Sending Crash Dumps for Stubborn Problems
Overview
If the app is able to start, it is probably already sending us its own diagnostics information about any crash that happens, so that we can repair the cause in a future update. A crash is a fault severe enough to cause an app to suddenly stop and be closed by Windows without warning you. However if the app consistently won't open for you at all, then we won't be receiving this information about the fault.
But there is something that you can do. Microsoft Windows may be saving helpful Crash Dumps to your device's storage. These Crash Dumps contain advanced diagnostics information that will help us to know about and to solve the problem. You can use our Crash Dump Reporter tool to find these Crash Dumps and send them to us. The tool will upload the Crash Dump files for the Scripture Study Bible app to our secure servers.
We look into every Crash Dump that we are sent and release updates to fix the problem as soon as possible - although in some cases that may take a couple of weeks.
All Crash Dumps we receive are handled according to our Privacy Policy. By choosing to run this tool you are choosing to sending us this Crash Dump diagnostics data during that run.
How To Download and Use the Crash Dump Reporter Tool
1. Download the Crash Reporter tool from the Microsoft Store on your device by following this link. An alternative link to find the tool in the Store website instead is here.
2. After download and installation have finished, the Get/Download/Install button will change to Open or Launch. Click the button again to run the tool.
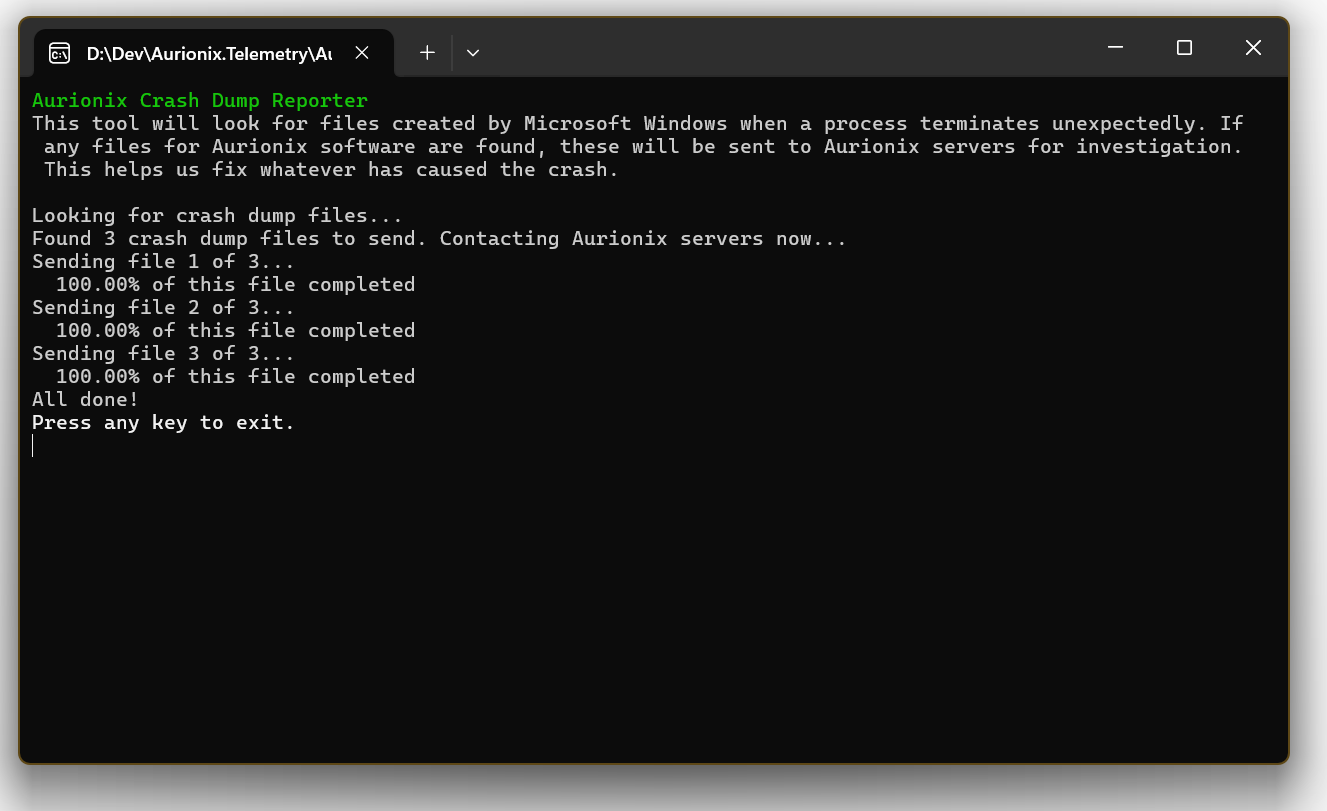
3. Let it run! A new window will pop up and may show results like the picture here. If you can't see the window, check your taskbar as it may be behind other windows.
4. Press enter to close the window, and you're done!
Advanced Reading & FAQ
Advanced Reading: Exactly What the Tool is Doing
First the tool will look in the current user's local app data folder on Microsoft Windows. Within that folder is a subfolder called CrashDumps. The tool will look at any files inside that subfolder and see if any are relevant to Aurionix software. You can see this folder yourself by opening %LOCALAPPDATA%\CrashDumps in Windows Explorer (press Start+R and enter that phrase then click OK). The tool will ignore files for software that it doesn't recognise.
If the tool finds relevant files, it will then contact Aurionix servers hosted securely in Microsoft Azure and ask them if they are happy to receive one or more Crash Dumps. If the servers are temporarily too busy then the tool will stop and you will need to run it again later. If the servers can't be contacted then the tool will ask you to check if your internet connection is working and then to try again.
If everything is well, the tool will then ask for a secure upload address for each Crash Dump file it would like to send. The tool then sends each file's content to the relevant address securely. The network traffic is encrypted during the upload. The only people able to view the files work for Aurionix and no-one else can download them.
Advanced Reading: Exactly What is Inside a Crash Dump File?
The Crash Dumps captured by Windows for this app are Small Memory Dump files, also known as Minidump files. A mini-dump is a snapshot of an app’s memory and state at the moment it crashed. It’s much smaller than a full memory dump, but still contains enough detail to help developers diagnose the issue. The mini-dump file contains:-
- Call Stack. This shows the sequence of function calls leading to the crash.
- Thread Information. Details about active processor threads and their states.
- Exception Information. The error code and message that triggered the crash.
- Loaded Modules. A list of DLLs and executables loaded into memory at the time of the crash.
- Memory Segments. Portions of memory from the crashing process (which might include app data).
- Processor Context. CPU register values, useful for low-level debugging.
- System Info. OS version, architecture, and other environment details.